September 15, 2023 | Digital Marketing, Power BI

Today, business intelligence tools are mainly used by data scientists and business analysts. Power BI tool offers all sorts of help for various executives who work from different departments and industries. Moreover, from mid-size to large organizations, from the finance industry to healthcare, from banking to manufacturing, with Power BI, all industries can get benefits.
According to the report by Dataprot, the global business intelligence market will be worth $29 billion by the end of 2023, and over 33% of the businesses will require decision-making tools by year-end. Also, the business intelligence market is expected to grow from $29 billion to $54 billion by 2030. Today, nearly 52% of software companies use BI tools to create an interactive dashboard and add analytics to their business. The industries that have started adding Power BI to their businesses have started to earn 5X times more by making faster decisions. This article will highlight Power BI, how it helps companies to grow, its services, processes, and everything you want to know about Power Business Intelligence.
Power BI, a Microsoft-owned business analytics service, helps users get interactive visualizations and business intelligence capabilities. It’s an application that combines organizational and industry data into interactive dashboards by adding smart visuals. The best way to implement Power BI strategies into your application is by connecting with one of the top Power BI development companies who can guide you in utilizing the full potential of Microsoft Power BI. The Power BI consulting team offers excellent support to help users identify the right KPIs, create interactive dashboards, and integrate them into third-party solutions.
The Power BI tool helps manage the database units, which are converted into an understandable visual where no technical expertise is required to implement. Power BI can add a detailed report of your organization’s database. One can add a tool for beginners to guide users to get the relevant learning knowledge. Adding data analytics features helps to use different commands and retrieve information while making significant decisions based on project requirements.
To start with, the Power BI architecture works as a service created on top of Azure. Initially, several data sources are connected to Power BI services. Power BI Desktop is used to add visualizations and create dashboards on the dataset. At the same time, the Power BI Gateway connects with On-premises data sources to track and get continuous reports. Power BI is a cloud service used to publish the generated reports. Moreover, using the Power BI applications, one can connect with Power BI Mobile apps to access data and reports from anywhere. After understanding the working of Power BI, let’s learn what features it brings for users.
This is the initial phase of our project life cycle. We connect with the client, understand their project vision, document what to do next and accomplish business goals.
We will understand what we need to accomplish in this phase. And how to do it? We plan the project based on available resources and within a given timeline.
In this phase, most of the development, design, and project deliverables take place. Communication is essential During this time, so we connect with our clients to get continuous updates and provide project progress.
The client can keep an eye on the project’s progress and control and monitor their project steps by keeping track of it.
This is the final step, where we deliver the project to the client and secure a sign-off or agreement form from the customer or project sponsor. Later, the team provides after-support and maintenance based on the discussion at the initial stage.
A Power BI consulting company helps your business deliver analytics services, enabling fast and informed decisions. Power BI consultants with years of experience assist clients using Power BI consulting services by guiding them to provide the best solutions. Customers can get a consultation regarding the following services. Hire Power BI Consultants and boost your business sales.
Power BI dashboards offer a customized way to show data, including spreadsheets, excel, cloud-based services, server databases, and more. Moreover, users can track KPIs, monitor their business, and get results from real-time metrics. One can add Power BI solutions to determine the integrity and analyze it by adding powerful insights. Add advanced AI capabilities while protecting your data across your organization. A few Dashboard examples are listed below,
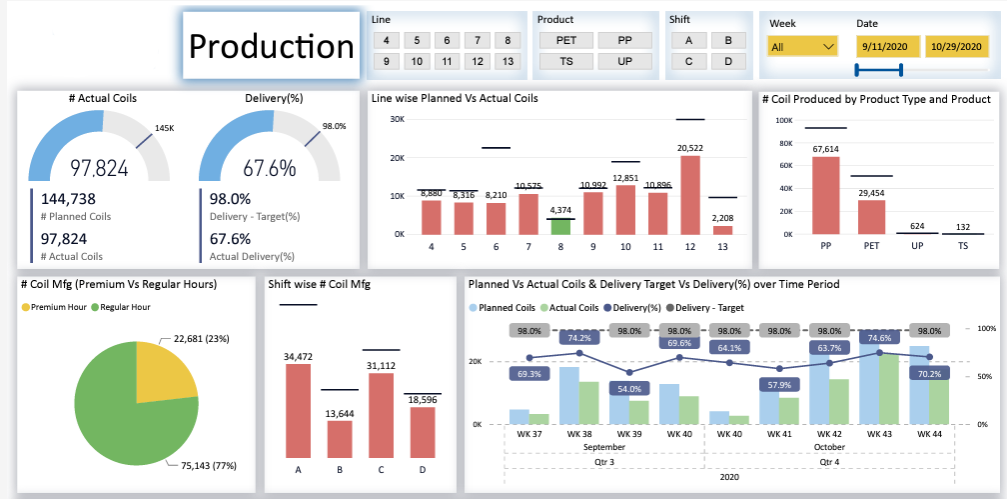
For Manufacturing:
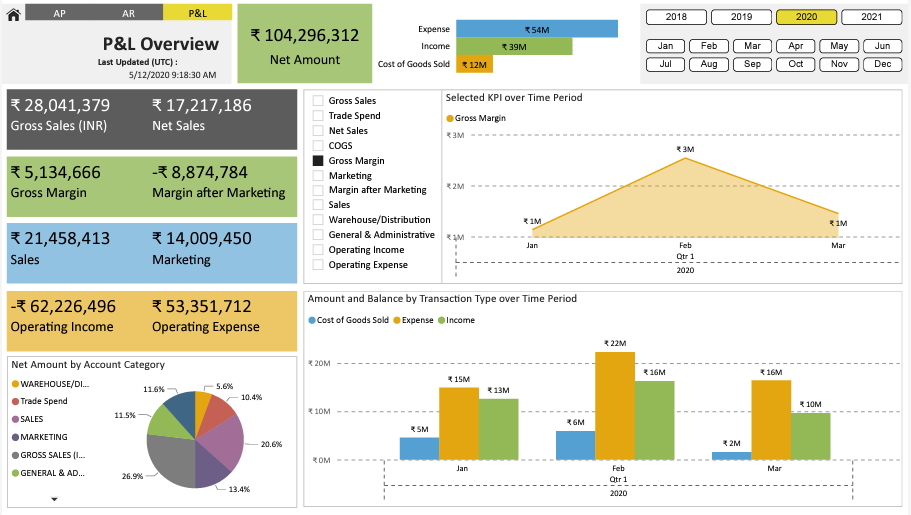
For Finance:
Connecting with Microsoft Solution Partner company provides an excellent team of professionals who support you in fulfilling the requirements for developers, implementation, and support teams. Power BI Integration services offer customers the best reason to integrate as they come with easy setup, cross-platform, and collaborative work culture.
Some integrations can be categorized with Power BI systems like Azure cloud platform, SQL database, Online Services, Blank Query, and other data sources. One can look for a reliable Power BI integration expert with decades of experience providing services across countries like India, the US, and Canada. Connect with the best Power BI development companies and empower your business globally.
Power BI report server works as an on-premises report server that is based on the SQL server reporting service architecture. Using the web browser, email access, a mobile device, and various types of essays are used with the report server. A few of the capabilities it includes are custom visualization, mobile connectivity, and other on-premises features. Here are the critical elements used with the Power BI Report server. It adds web portals, Power BI, Paginated, and mobile reports.
Microsoft Power BI is one of the most powerful platforms to migrate your existing data and tools to the most business-effective platform. The platform can deliver timely analysis by providing benefits like advanced data analytics, data visualization, and native integration with Power Apps, Azure, Power Automate, Dynamics Customer Voice, Office 365, Azure Synapse, and more. Choose one of the best Power BI development companies in India, the US, and Canada.
Data Modeling is a process of creating relationships between multiple tables and standard columns and detecting relationships automatically. Moreover, Power BI data modeling allows us to create new fields with calculated columns, create relationships between data sources, create a measure to perform data calculations and hide fields by optimizing data and sorting with data visualization. A few data models include the Network, Hierarchical, Relational, Entity-Relationship, and many more.
Data Analysis Expressions (DAX) is one programming language offered by Microsoft Power BI. It helps users create custom calculations by using formulas and adding more values. DAX mainly guides users to add additional columns and tables to generate reports, perform complex calculations, and manipulate data dynamically. Use the following flow to find the DAX formula in the Power BI service.
Connect with one of the top Power BI development companies to assist you with creating calculated columns, custom tables, and measuring functions based on the formulas through DAX in Power BI.
Microsoft Power BI Support service is essential to boost users’ productivity and offer the best Power BI solutions. Power BI consultants and developers help to meet your business needs and add technical changes to post-project deliverables. Users can easily use Microsoft Power BI managed services and support expert teams to improve, manage, and maintain their organization applications.
Connect with the top Power BI development service provider to help you create an HR dashboard to monitor the KPIs and run businesses efficiently.
This dashboard is very useful to run your enterprise efficiently. The main purpose of executive dashboard is to provide an excellent business data view based on their products and attributes. Add the custom visuals in different charts along with showing the important insight of your business.
Get ready to create your first Power BI dashboard for your manufacturing company and generate project dashboards to help your customers track project progress and status.
In finance, there are a lot of balance sheets, cash flow, profit and loss statements, expenditure, etc., to be added for proper data visualization. Create a financial dashboard to keep track of your income and spending.
As various departments are managing massive amounts of data, adding static spreadsheets is a must, which can lead to complexity. Therefore, marketing dashboards provide a clear strategy to add valuable insights with dynamic marketing dashboards. A few of them include,
The sales data added in dashboards are placed to understand the department’s accomplishments, employee performance information, and an in-depth sales analysis to make better decisions.
RFM (recency, frequency, and monetary) is a business model that helps organizations identify risk customers by transforming raw data into graphs, charts, and dashboards. It allows organizations to create RFM segments and RFM scores, visualize data, and connect datasets to Tableau.
Apart from the above dashboard, our Power BI professionals help to design a customized dashboards based on your industries and business requirements.
Power BI is a compelling platform to help developers quickly analyze, visualize, and create reports based on your business requirements. Add improvement to your business through proper planning, execution, and recourse utilization by using the right strategies and the right Power BI development company.
One can hire a Power BI Consultant to help businesses make their process easier by improving their decision-making. Moreover, Power BI consultants guide users to add innovative data analytics policies by adding analytical reports. A few of the main reasons to connect with Power BI consulting companies are listed below.
Copilot helps organizations to produce more accurate information. Copilot with Microsoft Power BI is powered by cutting-edge generative AI to support users in making the right decisions with great accuracy. One can integrate Copilot to create a powerful impression and streamline everyday processes easily. Copilot in Power BI adds an assistant that automatically analyzes data and generates reports based on asked questions.
No, AI cannot replace the traditional methods. At the same time, AI can adopt a useful Power BI development toolkit. They may not provide accurate information but can help to improve and simplify data visualization. No doubt, AI can analyze large chunks of data and help you stay one step ahead, but only humans can help with customer satisfaction, engagement, and personalization. Therefore, both need to work hand-in-hand to do the job effectively.
Yes, the Power BI dashboard can easily collaborate in Power BI app workspaces. Users can share reports, dashboards, apps, tiles, and more with workspaces. Once the collaboration is done, the user must create a file on the Power BI desktop and publish it to the Power BI app workspace. In case of any confusion, connect with a Power BI consulting company for easy resolution.
Power BI helps organizations to turn their insight into action. It offers users higher performance by leveraging its methodologies and support to make the best decisions. Choose the best Power BI developers and let them streamline your project to the next level.


atQor is a Microsoft Technologies focused boutique consulting, project services and product development company that aims to help end users increase business productivity by automating processes and compliance reporting.