May 31, 2021 | Digital Marketing, Power BI
Power BI, a Microsoft business analytics service, provides interactive visualizations and business intelligence capabilities with an interface simple enough for end-users to create reports and dashboards. It is a part of the Microsoft Power Platform.
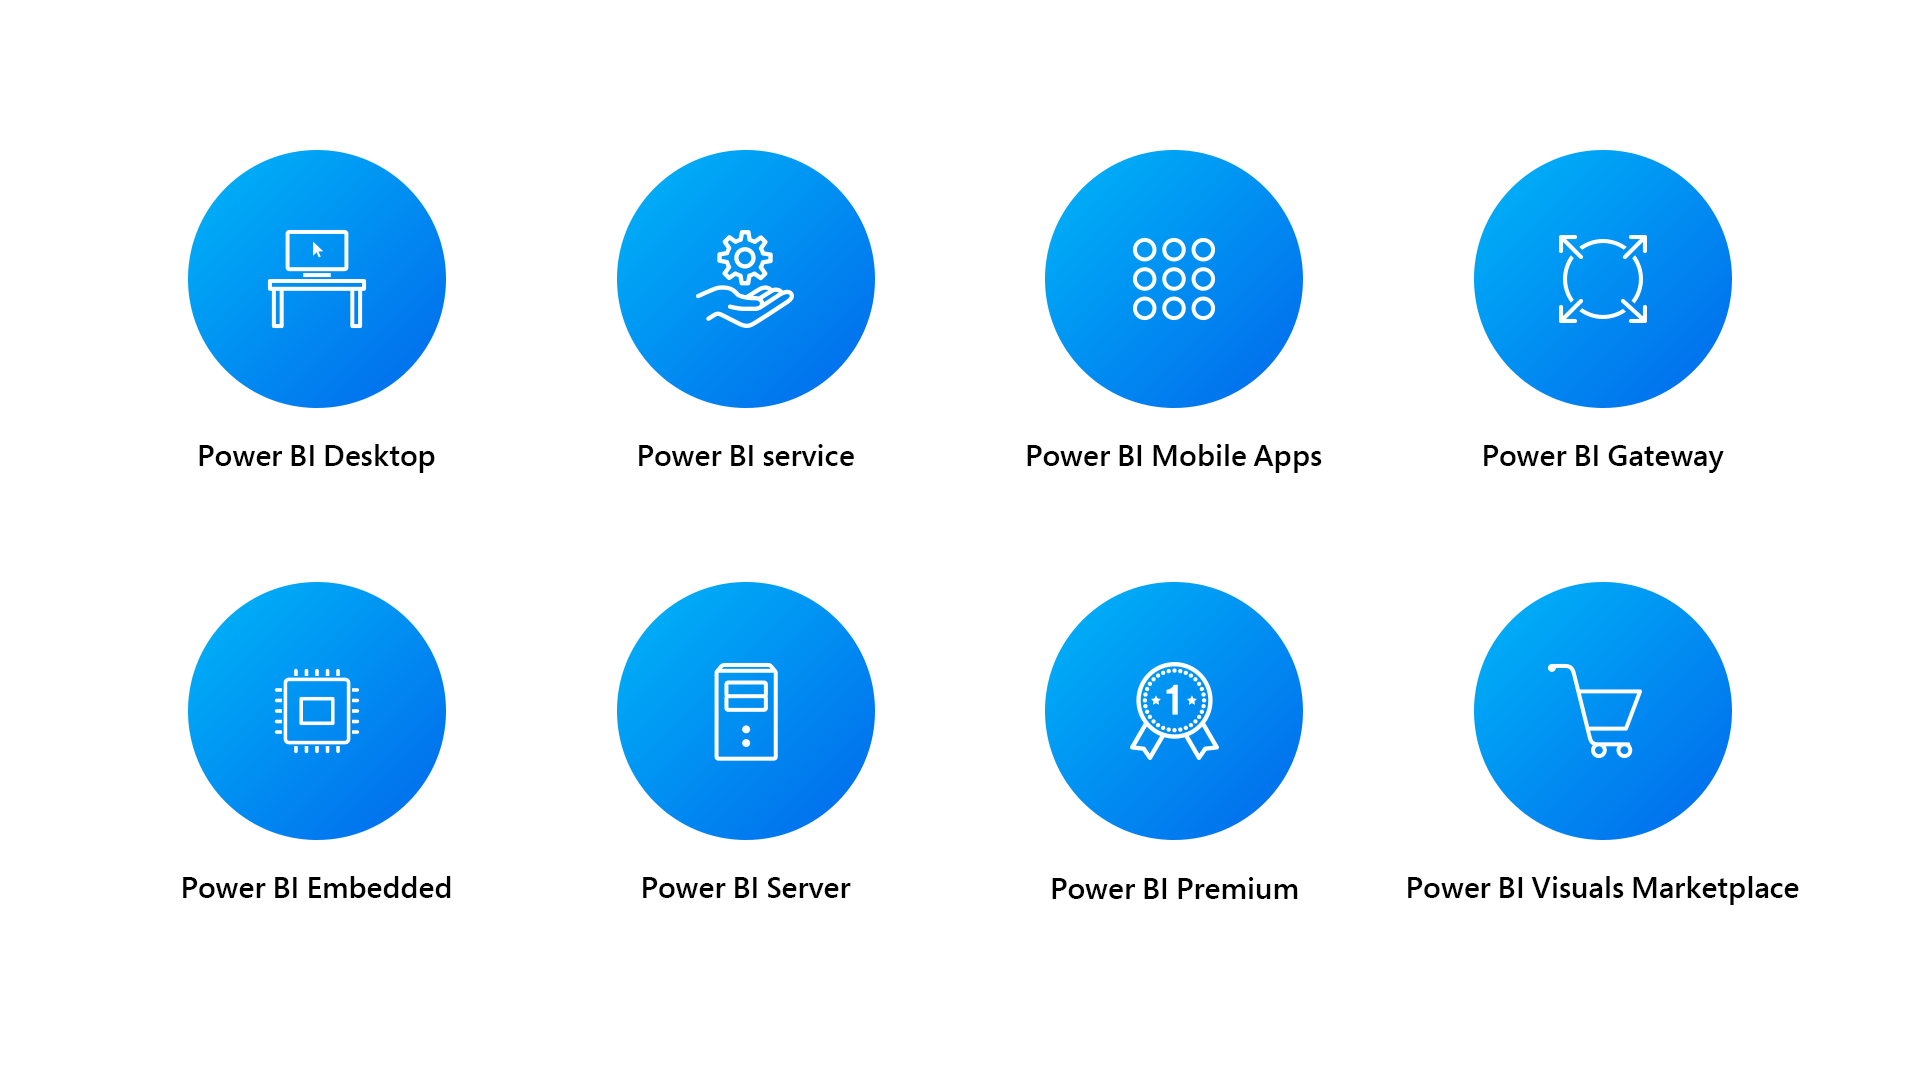
This is a windows-desktop-based function for PCs and desktops, largely for design and publishing of reports to the use.
This is a SaaS-based online service which was previously known as Power BI for Office 365, now known as just Power BI.
This is the Power BI mobile app for Android and iOS as well as windows phones and tablets.
It is used to sync external data in and out of Power BI and is needed for automated refreshes. It can also be used by Flow and PowerApps in Office 365 in Enterprise mode.
It is used to develop dashboards and reports into custom applications that serve Power BI users as well as to non-users.
It is an on-premises Reporting solution for companies that won’t and can’t store data in cloud-based data service.
It gives capacity-based offerings as well as the flexibility to publish reports across the enterprise without individual licensing required.
It is a marketplace for custom visuals and R-powered visuals.
The free version of Power BI is intended for small to medium business owners, and the professional version called Power Bi Plus is available with a monthly subscription fee.
Microsoft Power BI runs reports and derive insights from the same, based on the company’s data. It can connect to a wider range of data sets and purify the info it’s fed to better digest and understand. The visuals generated here can be shared with other users. It helps users see what happened in the past, occurring in the present, and might happen in the future. It has machine learning capabilities that help spot patterns in data and uses those patterns to make informed predictions about the what-if scenarios. These valuations allow users to create predictions and prepare themselves for future demands and other critical metrics.
Power BI is easy to gather data and access, organize, and visual representation. With built-in connectors like Azure, DropBox, and Google Analytics, you can load pre-built dashboards quickly, perform robust data analysis within minutes, and give customization options. Or the organization can import all the data and create dashboards for their data.
It has a drag-and-drop interface that is so easy to use, and it doesn’t need any technical expertise as such. And power BI also can combine multiple files and analyse the merged data in one report.
Power BI comes with a load of pre-loaded standard data illustrations to leverage in collaborative reports such as bars, columns, lines, maps, pie charts, scatter, etc.-with their variety of customization options for enhanced presentation and functionality. It also allows adding customized attributes and effects.
Advance excel users can find patterns easier with power BI with its Power Pivot features like clustering, forecasting, grouping, and quick measures. Power BI easily integrates with Excel, so much so that just by clicking ‘Analyse in Excel’ it presents an excel-like dashboard.
Power BI allows managing security and user access within the same surface rather than employing another tool for it. It also has Azure Active Directory (AAD) built-in for user authentication.
Microsoft’s digital assistant Cortana can be integrated with Power BI for instant access to the data and charts. With this integration, verbal questions can be asked in natural language and get rich, data-driven answers from business datasets.
Usually, business intelligence tools are used mainly by business analysts and data scientists, but due to the user-friendly nature of this application, it can be used by a range of people within a business. It can generate dashboards depending on data relevancy and information access. Different departments often use it to keep a check on their progress and derive insights into their team’s performance.
Power BI has various Competitors like Google data studio, Qlik sense, Amazon Quicksight, IBM Cognos that provide similar services but have some or other drawbacks that Power BI solves to an extent.
atQor is a leading IT company that provides Power BI solutions in more than 30 countries worldwide. It is a custom Power BI development service providing a company that enables customization according to the company’s needs.
It is one of the best Power BI Consulting Providers based in the USA. They hire some of the best Power BI developers to provide the best solutions and solve any issues regarding the same.


atQor is a Microsoft Technologies focused boutique consulting, project services and product development company that aims to help end users increase business productivity by automating processes and compliance reporting.