April 17, 2023 | Digital Marketing, Power BI
|
Based on the research, the below highlights show how Business Intelligence is helpful across various areas.
The above stats prove that all businesses seek excellent visualization and data representation. The main aim is to attract users and grow their business globally. OverviewPower BI, Microsoft’s leading business intelligence tool, has revolutionized how organizations visualize and analyze their data. With extensive features and capabilities, Power BI stands out among its competitors, offering unique and advanced functionality that sets it apart. In this in-depth technical blog post, we will explore some of the most advanced and exclusive features of Power BI that empower users to make data-driven decisions like never before. Dataflows and Power QueryA Dataflow is a data transformation service that runs on a cloud-independent Power BI dataset. Moreover, leverage the Power Query Engine by using Power Query Online and UI to simplify the data transformation. Moving on with Power BI Dataflows, it’s one powerful and cloud-based data preparation and transformation solution. It helps utilize Power Query, where users create dataflows that connect to various data sources, applies transformations, and store them to get the best data result in the Common Data Model format. How it helps organizations?
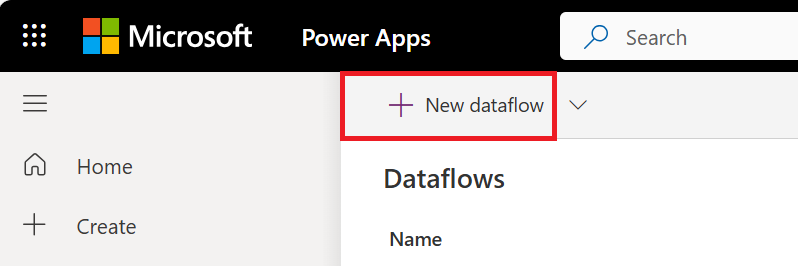
Example:Users can create dataflow using the Power BI desktop tools. The best way to do it is on a cloud, while with Power BI service, one can use it in the workspace. Here’s how to create dataflow, connect with the tool and fetch data.
Source: Microsoft Advanced-Data Modeling with DAXA data visualization tool developed by Microsoft helps to transform the way Data analytics works and solves the organization’s problems. DAX (Data analysis expressions) comes with a powerful formula language for creating advanced data models and driving insightful reports and visualization. While DAX is mainly used for function collection, constant, and operation to create Power BI expression and other data analytics services such as Excel Power Pivot, Microsoft SQL Server, and more. What are the unique capabilities DAX brings to organizations?
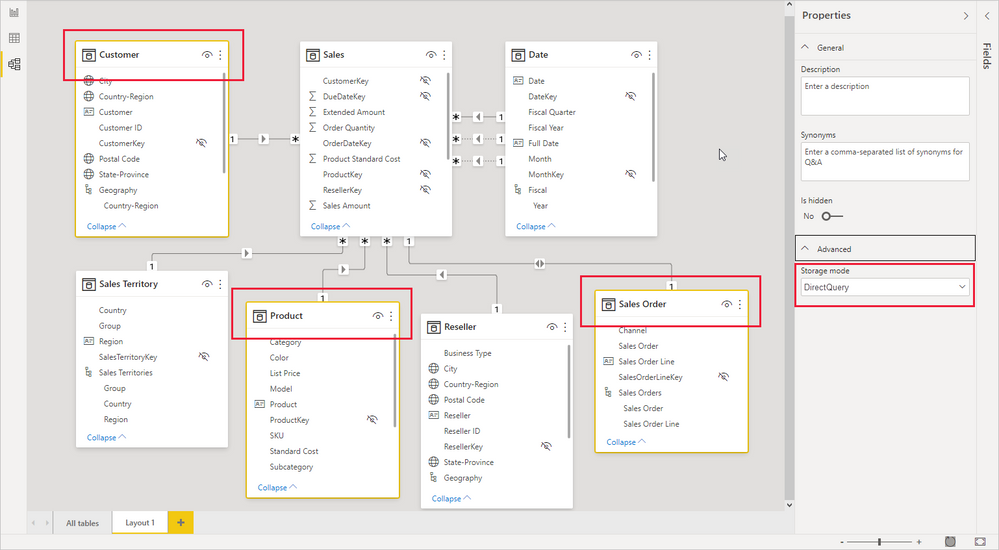
Example: Here’s how data models can be designed by using best practices.
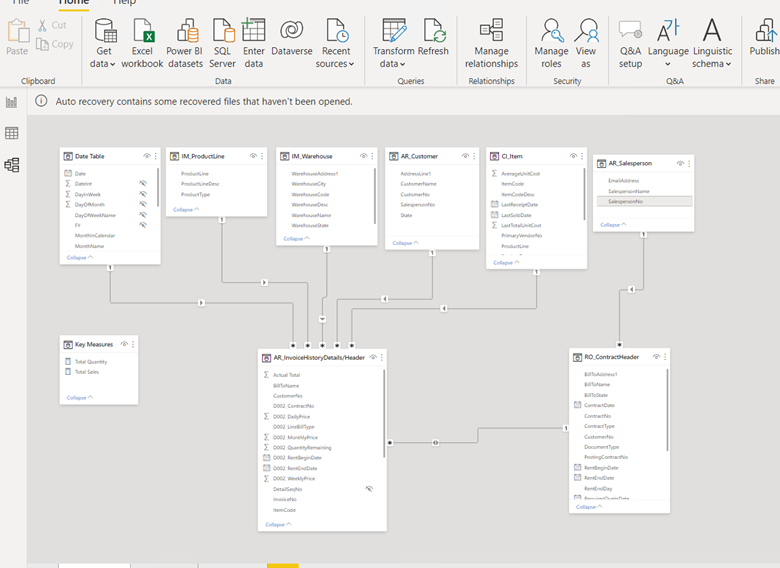
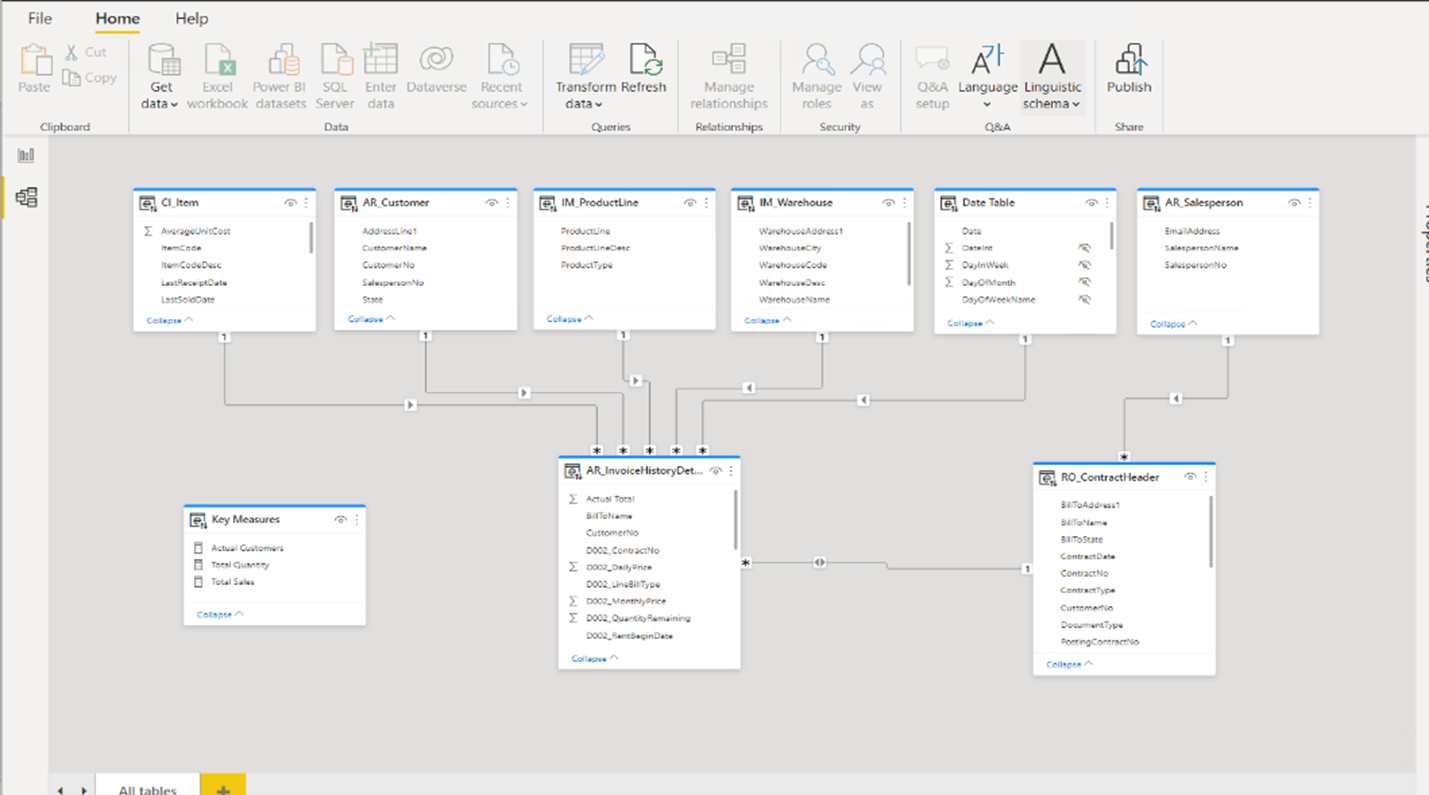
Example of how a power BI Data set looks like:
When image ‘a’ Data model and ‘b’ Power BI connects
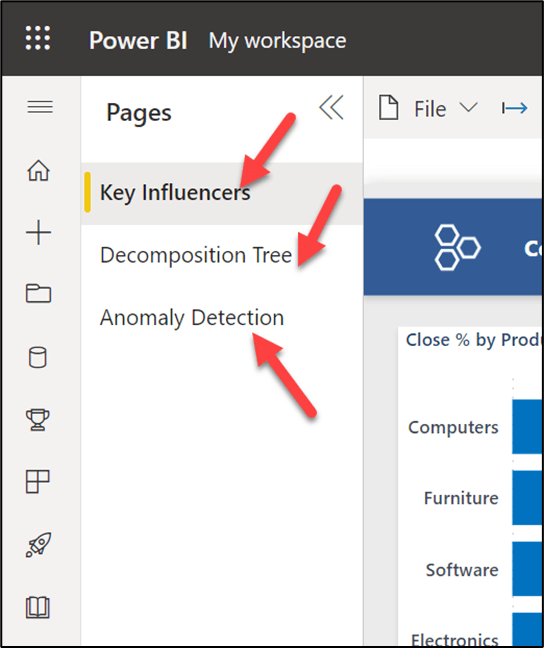
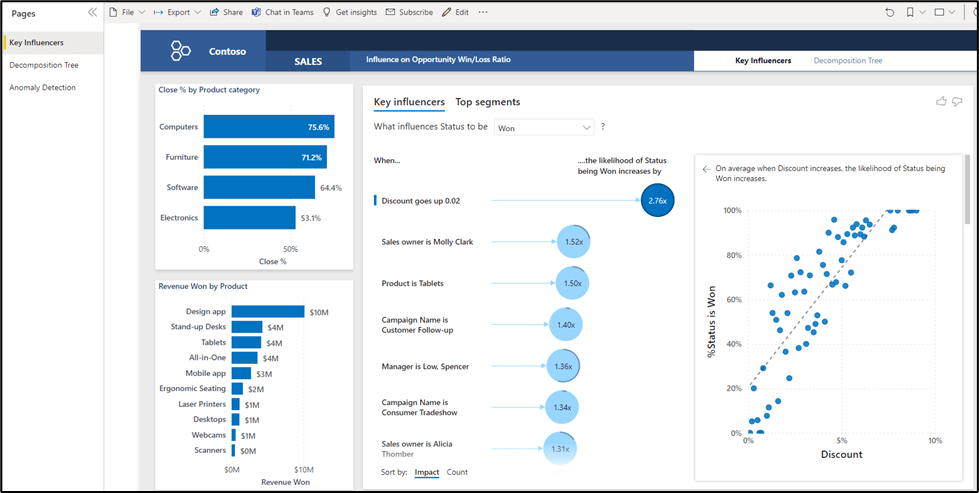
Power BI AI CapabilitiesThere are a lot of organizations that are keen to rely more on data than make data-driven decisions. Therefore, to make a better decision, we need excellent insight only offered by Power BI. Use Power BI to get the best visualization and better understand the tools and techniques. Further, use the AI capabilities to empower users to incorporate machine learning and natural language processing into their analyses. What are the features included in Power BI to help the organization?
The following figure shows Power BI that automatically opens AI reports as below: After display report looks like below
Custom Visuals and ExtensibilityPower BI comes with various default visuals; one can get from an App source. If the specific visual is unavailable, one can use custom visuals development to get one. Moreover, Power BI comes with distinct management possibilities, including embedded Power BI content to push data into Power BI datasets. It supports various custom visuals and extensibility options, enabling users to tailor their reports and dashboards to their unique requirements. One can build custom connectors to connect it with data sources used in standard Power BI service. What are a few key features included in Power BI?
Advanced-Data Security and GovernanceTake control of your data security, and use Power BI, as it is the best option and helps in offering a strong data governance strategy to empower the business unit and use it as data intelligently. As data governance is integral to Power BI implementation, it helps produce valuable and creative insights. It has robust data security and governance features to protect sensitive information and comply with industry regulations. What are the features data governance security offers?
Power BI and the Power PlatformPower BI is an integral part of the Microsoft Power Platform. It’s a suite of low-code with no-code tools to enable organizations to build custom applications, automate processes, and analyze data. This platform can help users surface, manipulate, automate, and analyze data used along with Office 365 and D365. What are the unique capabilities the platform offers for users?
Why should you use Power BI?Power BI includes data preparation, an interactive dashboard, and visualization to add to one solution. It helps to make an intuitive tool to interact with data and quickly turn it into insight. A few of the reasons you should choose Power BI are listed below:
ConclusionPower BI has proven itself a leading business intelligence tool that offers advanced and unique features and sets it apart from its competitors. One can improve an organization’s business intelligence using robust data preparation and transformation capabilities. Now it’s time to get seamless integration with the Power Platform, Power BI, and continues to empower your organizations to unlock the full potential of data and confidently make data-driven decisions. Are you interested in adding a bountiful advantage to your organization? Talk to our consultant and get started. |


atQor is a Microsoft Technologies focused boutique consulting, project services and product development company that aims to help end users increase business productivity by automating processes and compliance reporting.