December 20, 2021 | Digital Marketing , Power BI

In the world of Big Data, data visualization tools and techniques are essential to analyze a huge amount of data and make data-driven decisions. The technological revolution took expensive and difficult data to abundant and incomprehensible. Traditional software makes it impossible to store, understand and analyze the increasing volume of data.
The survey of Forbes on business analytics says that more than 95% of organizations need to manage unstructured data and more than 40% of businesses say they do it regularly.
Data Visualization is what helps turn the ocean of data into easily understandable, visually compelling, analytical insights. Nowadays, technological advancements help to make data visualization easier and more effective.
The data visualization tools allow us to see and understand trends, outliers, and patterns in data. Even with the assistance of digital data visualization tools, organizational users can make quick decisions without wasting time structuring formless data.

Microsoft Power BI derives insights and runs reports based on the company’s data. It connects to a larger variety of data sets and sorts outs the data it’s fed to absorb better and understand. The visuals generated in this can be shared with other users.
It helps users see past happenings, present occurring, and future possibilities. It contains machine learning capabilities that help spot patterns in data and use those patterns to make informed forecasts about the ‘what-if’ scenarios. These evaluations help uses predict events and prepare ourselves for future demands and crucial metrics.
Typically, business intelligence tools are used mainly by business analysts and data scientists, but the app’s user-friendly nature can be used by a range of professionals within a business.
Depending on data relevancy and information access, it can generate dashboards. Different departments use it differently to keep a check on their progress and derive insights into their team’s performance.
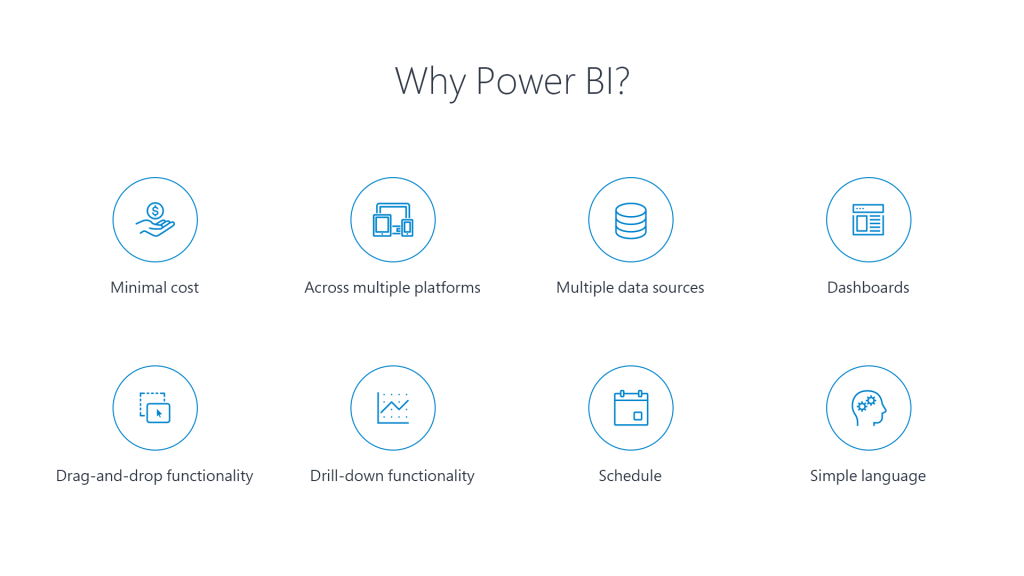
Power BI has a free version, and its pro version has a monthly subscription facility. Thus, it can be very cost-effective and budget-friendly for the organization. Also, the organization only has to pay for the feature it wants, with no minimum payment and wastage. This is very beneficial and useful to the company. This avoids any wastage and medley in the tool.
Power BI is available across all platforms and devices. It can be accessed from anywhere at any time. This is what makes it really helpful and easy to use. It just needs a device with internet access and Power BI supporting service.
Power BI is compatible with Microsoft and also with other sources like Excel, SQL Server, IBM database, etc.
Power BI makes it easy to generate dashboards, which are simple to share with other users and tailor the features there.
Power BI dashboard has a drag-and-drop facility that helps to make presentation and analysis easy and instantly. Anyone without any technical experience and expertise can analyze data, gain meaningful understandings, and create reports on the same with the help of this functionality.
If any attribute or function needs specification, then going deep down into it is called drill-down functionality. For e.g., If an employee’s attendance is 85% and the manager wants to know the specifications of this attendance, drill-down functionality comes in handy.
Power BI has a feature where you can schedule data to refresh daily or even hourly.
Power BI has integrated Machine Learning and thus can understand questions asked in secular language. It understands that and replies appropriately to the question, giving expected results and answers.
Microsoft-provided Power Bi solution is a leading market data visualization and analytical tool, and it will hopefully continuously rule the market.
Organizations need a Power BI solution in the future too, and the main reason is data. Data for any industry plays a vital role; days pass, but the requirement to analyze the data will remains the same.
Also, day-by-day managing huge data is becoming hectic and time-taking, so the demand for such data visualization tools will drastically increase in the future.
Considering the above information, you come to a conclusion that how much your company needs one data visualization and analytical tool for data structurization and quick decision-making.
atQor is a Power BI development services provider and consistently growing technology leader that delivers Microsoft Power BI solutions in multiple countries worldwide. It provides customized Power BI development services to businesses as per their needs.
It is one of the prominent and certified Power BI Consulting Providers based in the USA. They hire several finest Power BI developers to provide the top solutions and solve any issues.