November 11, 2021 | Digital Marketing, Power BI

Microsoft has treasured a remarkable Business Intelligence tool that allows you to gather information from various data sources and represent them on the dashboard. The stats and data are elegantly represented in a visual context using the enormous illustration mode like charts, graphs, and maps.
So, the Power BI operation dashboard is a data visualization screen that offers a holistic view of the subject, agenda, or business, just at a single glance. Through such availability, users can explore the Power BI capabilities. Unlike reports, a dashboard is a single canvas that gives a consolidated overview of the data offering you a visual representation of the important aspect comprising the complete story.
atQor, A noteworthy Gold Partner of Microsoft, gives you an exceptional Power BI Dashboard Development service that would leverage your company with a smart and intelligent platform for analytical data visualization within your budget boundary. So no matter, whatever your organization’s size is, we promise you a customized and integrated Power BI solution versioning from Power BI Desktop, Power BI Pro, and Power BI Premium that meet the trending market requirement, making the business more profitable, strategized, and functional.
Our contemporary Business Intelligence solution particularly accumulates the data, Determines the integrity, and converges the data on one frame that gives a deep, meaningful, and actionable insight into various business segments. Empowered by AI (Artificial Intelligence), We assure advanced data protection and lines of easy-interpreted insights like:
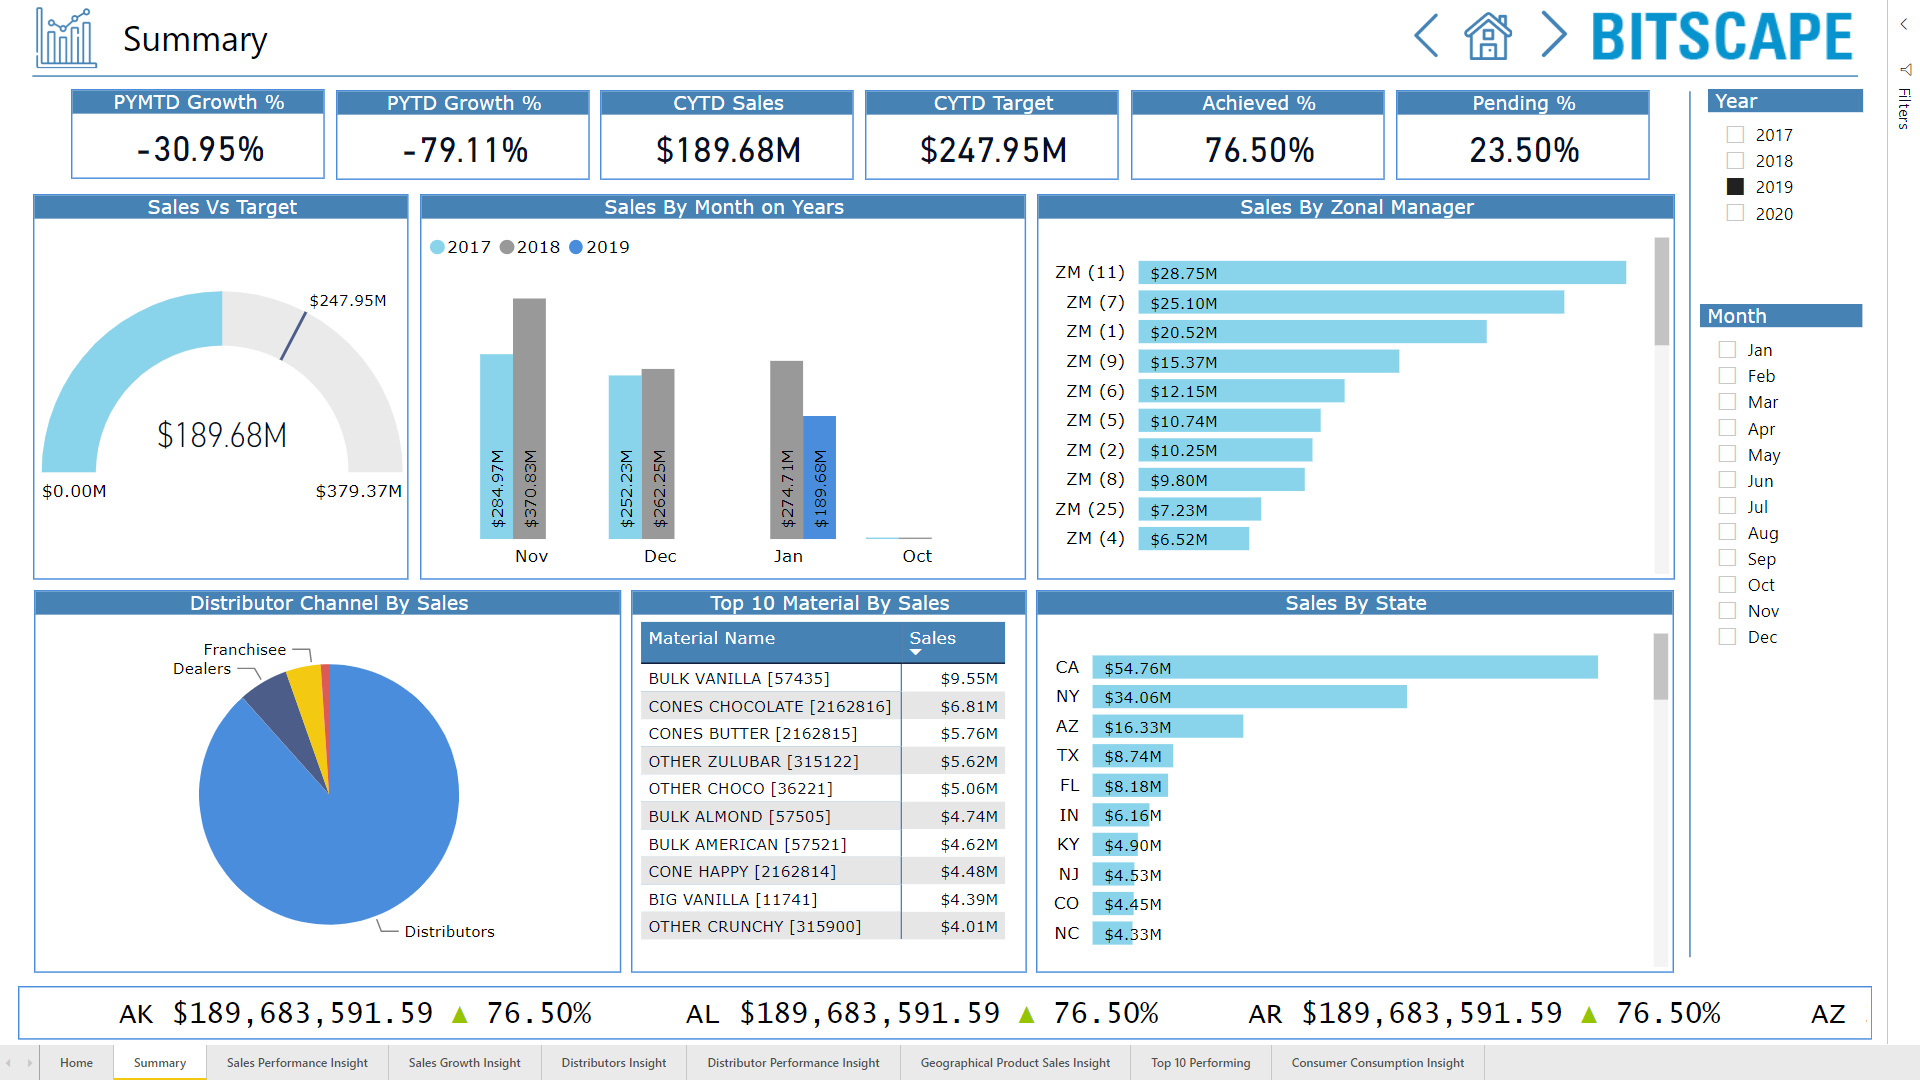
Get a complete overview of your sale and analyse the effectiveness of the current plan in a decent and sophisticated manner. Evaluate the profit rate and achieved% vs. pending%. This will eventually let you bifurcate the Top performers, Average performers, and worst performers.
With these magnificent dashboard features, You can analyse the incidents weekly, monthly and annual terms. Get the opportunity to filter the data as per the date, week, or site. Evaluate the actual revenue generation compared to the highlighted revenue generation within the given date and time.
Our analytical dashboard gives a clear identity of the quality, the Total Number of complaints, the number of complaints registered, and the Number of resolutions given.
So, if you are looking forward to gauging your manufacturing systems’ overall effectiveness, This dashboard is a one-stop solution for the purpose.
This dashboard analyses the investment of clients and the Assets under Management (AUM) as per the city and location. Evaluate the KYC updates of your customers and clients from different states utilize the ways your funds can be analysed or valued. Apart from this, you get to identify the availability of products at the warehouse and delivery station.
An ethical business always exhibits value to the customer. Instead of focusing on revenue generation, it analyses customer satisfaction, Retention rate, loyalty, and customer relation. RFM is itself an abbreviation of Recency, Frequency, Monetary, and it is exactly what this dashboard focuses on.
Empower your HR team with complete visualization of Budget vs. Onboard and Employee training. This streamlines the human resource functionality and gives a detailed insight into the ROI (Return of Investment).
Empower your HR team with complete visualization of Budget vs. Onboard and Employee training. This streamlines the human resource functionality and gives a detailed insight into the ROI (Return of Investment).
This dashboard evaluates the production of a product. Examine your runtime, Downtime, Waste generated, and overall efficiency of a machine. A good Power BI expert always ensures the availability of these analytics in the business intelligence tool.
As a Microsoft BI Partner, we give you an excellent opportunity to track the employees’ productivity. Get the details of the project schedules; Time spent task completion via timesheet. Managers widely use this tool to enhance the performance of the team.
So, don’t be late, get your Guide to Business Intelligence Tool now. Countless Power BI experts are floating in the market, but the vicious and customised Business Intelligence Solution delivered by atQor is truly incredible.


atQor is a Microsoft Technologies focused boutique consulting, project services and product development company that aims to help end users increase business productivity by automating processes and compliance reporting.